
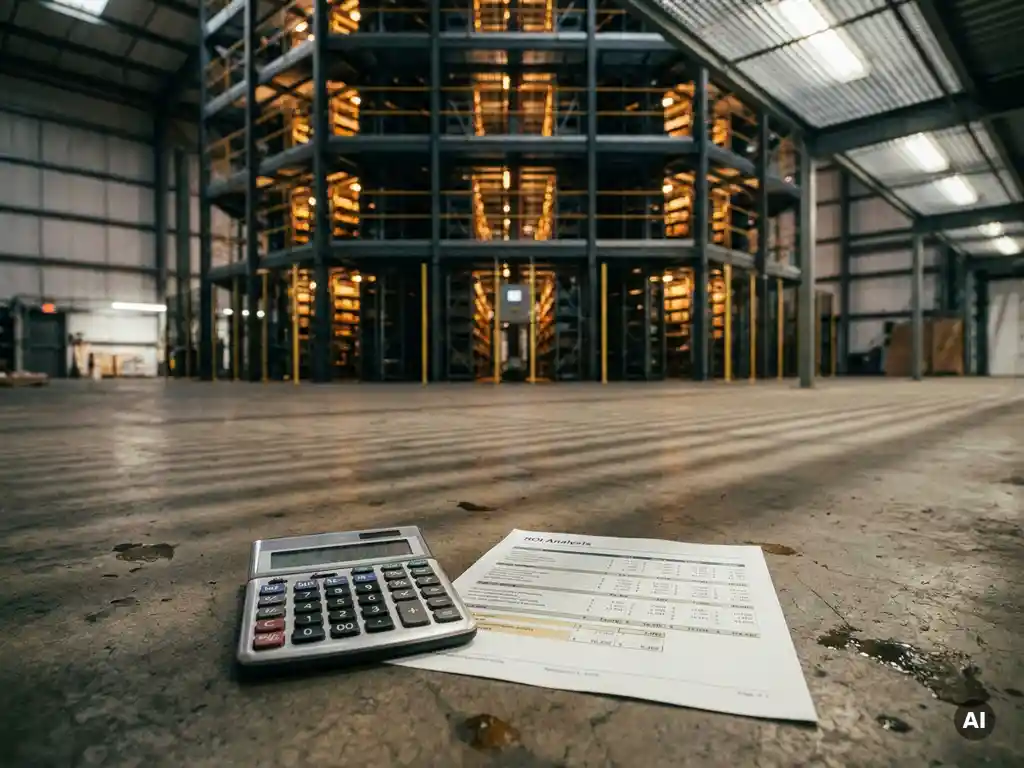
The financial metrics that matter most when justifying an automation investment are return on investment (ROI), total cost of ownership (TCO), and payback period. These three form the foundation of any credible business case. Supporting metrics like labor cost reduction, throughput capacity gains, and error rate improvements strengthen the argument further. For industrial engineers and operations leaders, the challenge is not choosing a single metric but building a model that connects all of them into a coherent financial narrative that approvers can trust.
Which financial metrics carry the most weight with approvers?
The metrics that carry the most weight with financial approvers are payback period, ROI, and net present value (NPV). Payback period answers the most immediate concern: how quickly does the investment recover itself? ROI quantifies the return relative to cost. NPV captures long-term value by accounting for the time value of money. Together, these three give approvers a complete picture of risk and reward.
Beyond these headline figures, approvers increasingly scrutinize labor cost reduction as a concrete, recurring saving that is easy to validate. Headcount reallocation, overtime elimination, and reduced dependency on seasonal staffing all translate directly into annual savings that compound over time. Error rate reduction and inventory accuracy improvements are also gaining weight in approval processes, particularly in operations where picking errors trigger returns, write-offs, or compliance penalties.
The practical reality is that approvers at different levels prioritize different metrics. Finance teams focus on NPV and payback period. Operations directors focus on throughput gains and uptime reliability. Executive sponsors focus on strategic flexibility and scalability. A strong automation business case addresses all three audiences within the same document, using the same underlying data presented through different lenses.
How is ROI calculated for a warehouse automation project?
ROI for a warehouse automation project is calculated by dividing the net financial benefit of the system by its total cost, expressed as a percentage. The net benefit is the sum of all measurable savings and revenue gains over a defined period, minus the total investment. A positive ROI means the project returns more than it costs; the higher the percentage, the stronger the financial case.
In practice, calculating ROI for warehouse automation requires building a structured benefits model. The most common benefit categories include:
- Labor savings: Reduced headcount requirements, lower overtime costs, and decreased reliance on temporary workers
- Space efficiency gains: Higher storage density within the same footprint, which can defer or eliminate the need for facility expansion
- Throughput improvements: Faster order fulfillment cycles, higher picks per hour, and reduced order lead times
- Error reduction: Fewer mispicks, lower return rates, and reduced rework labor
- Inventory accuracy: Better stock visibility, reduced shrinkage, and lower safety stock requirements
Each benefit category should be quantified conservatively and tied to a specific baseline. Using current operational data as the starting point produces a more credible ROI calculation than relying on vendor-provided benchmarks. The investment side of the equation must include not just hardware costs but also software licensing, integration, installation, and training, which are covered in more detail under total cost of ownership.
What is total cost of ownership in warehouse automation?
Total cost of ownership (TCO) in warehouse automation is the complete financial cost of acquiring, deploying, operating, and maintaining an automated system over its full operational life. TCO goes beyond the initial purchase price to include every cost that the system generates from installation through end of life. It is the most accurate basis for comparing automation solutions because it reveals the true long-term financial commitment.
TCO in warehouse automation typically breaks down into three phases:
Acquisition and deployment costs
This phase covers capital expenditure on hardware, software licenses, civil works, power infrastructure, and systems integration. It also includes project management, commissioning, and staff training. For complex automation projects, integration costs alone can represent a significant portion of total upfront spend, which is why systems with standardized APIs and minimal infrastructure requirements tend to produce lower TCO from the outset.
Operational and maintenance costs
Once the system is live, ongoing costs include energy consumption, preventive maintenance, spare parts, software support contracts, and operator labor. Systems architecture has a direct impact here. A design that eliminates in-rack electrification, for example, reduces both energy draw and the number of failure points that require servicing. Distributed robotic systems that continue operating when a single unit is offline also reduce the cost of unplanned downtime, which is one of the most underestimated operational expenses in automation.
Scalability costs also belong in the TCO model. If increasing throughput requires structural redesign or duplicating core infrastructure, those future costs should be modeled now rather than discovered later.
How does payback period differ from ROI in automation decisions?
Payback period measures how long it takes to recover the initial investment from net savings or gains, expressed in months or years. ROI measures the total return relative to the total cost, expressed as a percentage. Payback period answers “when do we break even?” while ROI answers “how profitable is this investment overall?” Both metrics are essential, but they serve different decision-making purposes.
Payback period is particularly important in automation decisions because it reflects risk exposure. A shorter payback period means the organization recovers its capital faster and is less vulnerable to changes in business conditions, technology, or strategy. For most industrial automation projects, a payback period of two to four years is considered acceptable, though this varies by industry, investment size, and organizational risk tolerance.
ROI, by contrast, is better suited for comparing competing projects or technology options. A system with a longer payback period may still deliver a superior ROI if it generates higher returns over its operational life. This is why both metrics should appear in any credible automation business case: payback period satisfies the risk question, and ROI satisfies the value question.
One common mistake is treating a short payback period as sufficient justification on its own. A project can pay back quickly but still deliver poor long-term ROI if maintenance costs escalate, throughput limits are reached early, or the system cannot scale without significant reinvestment. The two metrics work together, not in isolation.
What hidden costs can distort an automation business case?
The hidden costs most likely to distort an automation business case are integration complexity, infrastructure modifications, scaling constraints, and unplanned downtime. These costs are frequently underestimated or omitted from initial proposals, which creates a gap between projected and actual financial performance. Identifying them early is essential to building a business case that holds up after deployment.
The most common hidden cost categories include:
- WMS and ERP integration: Connecting automation systems to existing warehouse management or enterprise resource planning software can require significant custom development if the automation vendor does not offer standard APIs
- Facility modifications: Floor reinforcement, fire suppression upgrades, power supply changes, and lighting adjustments are often excluded from vendor quotes but required before installation can begin
- Transition and ramp-up costs: Operating parallel manual and automated processes during cutover generates temporary labor costs and productivity losses that are rarely modeled in advance
- Scaling costs: Systems where adding throughput requires structural changes or centralized equipment duplication carry hidden future costs that do not appear in the initial TCO model
- Single points of failure: Automation architectures that depend on centralized cranes or conveyor systems create downtime risk that should be quantified as a cost, not ignored
- Vendor lock-in: Proprietary components, non-standard totes, or exclusive maintenance contracts can inflate long-term costs significantly
The most effective way to surface hidden costs is to require vendors to provide a fully itemized deployment scope and to benchmark that scope against similar projects. Engaging an independent integrator or systems consultant to review vendor proposals also helps identify gaps before contracts are signed.
When should throughput capacity factor into the financial model?
Throughput capacity should factor into the financial model from the beginning, not as an afterthought. Throughput directly determines how much revenue a warehouse operation can generate per hour of operation. If the automation system cannot meet peak demand, the financial model overstates the benefit. If throughput scales independently of storage capacity, the model must capture that flexibility as a distinct financial advantage.
The key throughput variables to model include current picks per hour, projected peak demand, order cycle time requirements, and the cost of throughput shortfalls. Throughput shortfalls manifest as delayed shipments, missed service level agreements, customer penalties, and overtime labor costs. These are real financial exposures that belong in the business case alongside the positive savings metrics.
Throughput scalability is particularly important in operations with seasonal demand peaks or rapid growth trajectories. A system that requires structural redesign to increase throughput locks the organization into a fixed performance ceiling until the next major capital investment. A system that scales throughput by adding autonomous units operates within the same infrastructure, which means the financial model can treat future throughput increases as incremental operating costs rather than capital events. That distinction has a material impact on both ROI and NPV calculations over a five-to-ten-year horizon.
When modeling throughput, also account for system resilience. A distributed architecture with no single point of failure maintains throughput during partial outages, which protects the revenue assumptions built into the financial model. A centralized system that halts entirely when one component fails introduces a throughput risk that should be quantified as a downtime cost in the business case.
How Hexxabotics helps with justifying automation investment
Hexxabotics is designed to make the financial case for warehouse automation straightforward and defensible across every metric that approvers scrutinize. The system’s architecture directly addresses the most common sources of financial uncertainty in automation projects:
- Independent scalability of capacity and throughput means future growth is modeled as incremental cost, not capital reinvestment, which strengthens both ROI and NPV projections
- No in-rack electrification reduces energy consumption, eliminates a major category of maintenance cost, and simplifies the TCO model
- Distributed robotic operation with no single point of failure protects the throughput assumptions in the financial model by maintaining stable performance even when individual units are offline
- Standard API integration reduces the hidden integration costs that most commonly distort automation business cases
- Modular structure with no client-specific engineering lowers deployment cost and accelerates payback period
If you are building an automation business case and want to understand how a high-density AS/RS system maps to your specific financial metrics, learn more about Hexxabotics or explore the full system to start the conversation.
Related Articles
- What are the benefits of autonomous mobile robots in warehousing?
- What are the long-term operational costs of warehouse automation?
- Can warehouse automation lower your energy consumption?
- How does predictive maintenance prevent downtime in automated warehouses?
- Should you choose an AMR system or a fixed-rail AS/RS in 2026?